week 14: interface and application programming
The assignment for this week was to design an application that would visualize the input received from the magnetic sensor board designed in Week9 (Input Devices). The tutorial at http://academy.cba.mit.edu/2012/labs/providence/tutorials/12.html proved to be of great help.
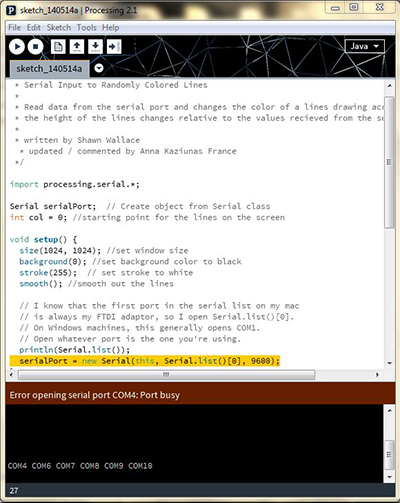
As a beginning, I and started with the example given in the tutorial. However, the sketch failed to take the input reading. The COM4 port was referred by default in the sketch but it was shown to be busy in my computer.
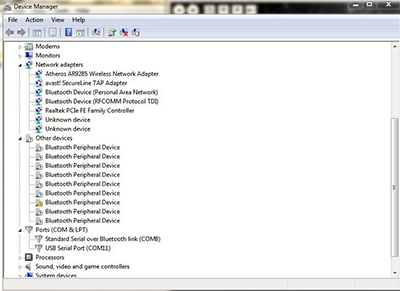
I had a look at the Device Manager and found that only COM11 was available.
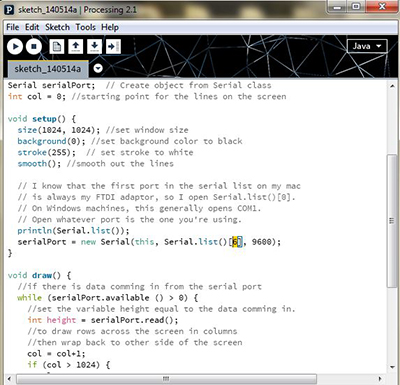
I updated the array index from 0 to 6 so that the COM11 port is referred to by the sketch. And it worked!
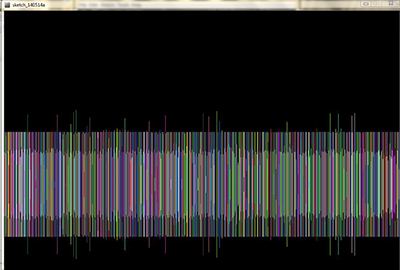
The example worked with a band of lines indicating the magnitude of the magnetic field detected.
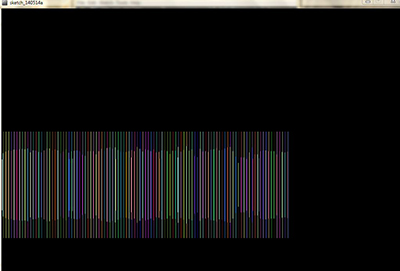
However, the values weren't large enough or not varied enough to cause significant variation in the lines.
I decided to tweak the sketch to generate another visual
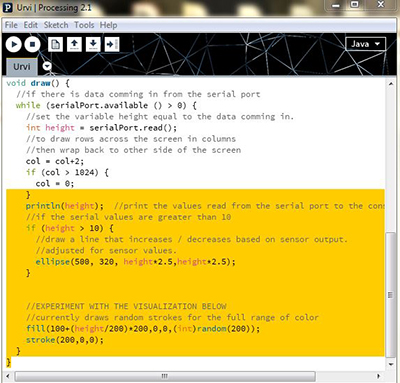
I decided to remove the horizontally moving value "col" and instead just used the height parameter to sketch a circle with radius as the measured value x 2.5. The magnification was done to make the small variations visible. Even the intesnsity of the fill color red was tweaked to depend on the magnitude detected.
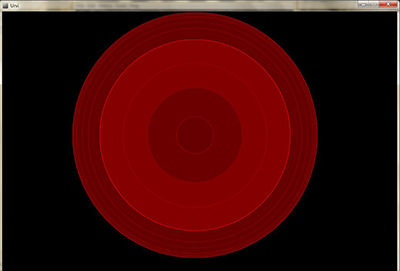
A nice visual was generated